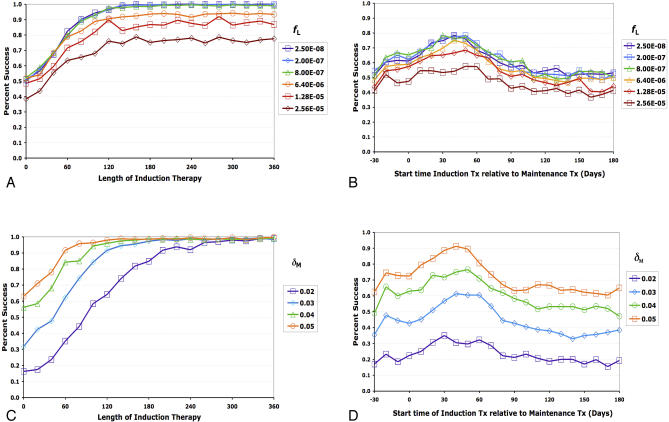
Figure 6. Computer Simulations Showing Relationships Between Long-Lived Infected Cells and Treatment Success Rates.
(A,B) Effect of proportion of infected cells becoming latently infected quiescent memory T lymphocytes (modeled here by changing f L).
(C,D) Effect of varying the death rate of moderately long-lived infected cells, δ M (modeled here with simultaneous increases in f M in order to keep the pre-therapy density of moderately long-lived cells the same in each simulation).
(A) and (C) demonstrate success rates as the duration of induction therapy is increased, and (B) and (D) demonstrate success rates over a range of induction therapy start times. x-Axis indicates duration of induction therapy in days (A,C), or the interval between the start of a 30-d induction period and maintenance therapy in days (B,D). Maintenance therapy is assumed to start on day 0. y-Axis indicates percentage of simulations in which viral load remained undetectable for at least 3 y after ending induction therapy. Data in each panel were based on 400 simulations. Interpretation: the death rate of moderately long-lived infected cells is a major determinant of how long induction therapy should last. At expected rates of f L (rate at which infected target cells transition to quiescent memory T lymphocytes), success rates depend little on rebound from the latent reservoir. However, success rates decline as the rate of virus input into the latent reservoir exceeds ∼6.4 × 10⁻⁶ per infected cell, indicating that rebound of resistant virus from the latent reservoir becomes a significant factor.

