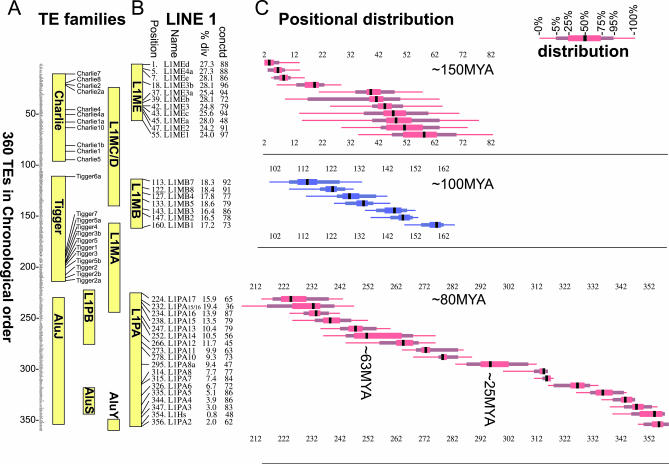
Figure 3. Chronological Ordering of Human TEs.
(A) Chronological order of 360 human TEs as derived by IMA. The individual names of the elements are not visible in Figure 3 (see Table S2 for full dataset). The range of positions of several TE families is shown (yellow bars) to illustrate the agreement with previous phylogenetic age analyses. The names and positions of the Charlie and Tigger families of DNA transposons are shown.
(B) Position of individual elements from the L1 subfamilies L1ME, L1MB, and L1PA. Also shown is the median percent divergence from the Repeat Masker–derived consensus sequence (Table S2), and the percent connectedness of this TE in the matrix (see text and Table S2). In general, the percent divergence agrees well with the relative age of the element as determined by IMA.
(C) The positional distribution for the TEs listed in (B) is displayed on the horizontal axis, relative to the overall chronological order of 360 elements on the vertical axis. (Thin line, range of the lowest 5% or highest 5% of positions calculated; thicker line, range of the next lowest 20% or next highest 20% of positions calculated; thickest line, range of middle 50% of positions calculated; black bar, median position). The chronological order in (A) was derived by ordering the medians of the positional distributions.

