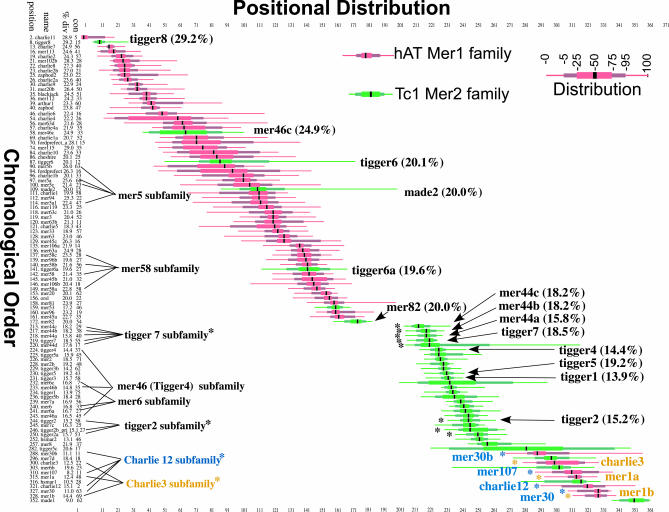
Figure 4. Analysis of DNA Transposon Activity in the Human Genome.
The chronological order for MER1 (red) and MER2 (green) families of DNA transposons, taken from the 405 elements used in this run of IMA, is shown on the left (vertical axis) from oldest (top) to youngest (bottom). The positional distribution is shown on the horizontal axis. The name of each element, its position in the chronological order (out of 405 elements), the median percent divergence (Table S2), and the percent connectedness (Table S2) are shown. The two major radiations of MER1 and MER2 DNA transposons can be seen. Subfamilies of DNA transposons containing autonomous parental elements and dependent nonautonomous elements are indicated. The following DNA transposons were not included in this figure because of either low connectedness and/or long positional distribution, for space and clarity (position name; % divergence; connectedness): (37 MER102a- 27.9; 5), (41 MER69b- 25.1; 20), (45 MER91- 23.9; 6), (59 MER91b- 25.8; 9), (72 MER97c- 23.6; 33), (85 MER117- 28.1; 15), (95. MER69a- 24.3; 10), (103 MER91a- 30.4; 12), (105, MER91c- 26.5; 9), (106 MER58d- 19.9; 10), (110 MER97a- 22.6; 7), (117 MER97b- 24.4; 5), (143 Tigger6b- 19.0; 5), (127 MER4–5 21.4; 15), (125 MER45-r 21.0; 13), and (210 pMER- 15.9; 0).

