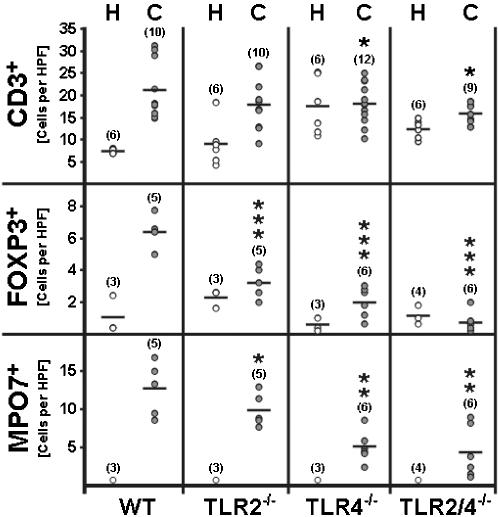
Figure 2. Quantification of immune cells in the colon of DSS-treated mice.
Numbers of T-cells, regulatory T-cells, and neutrophils in the colon of DSS-treated wt mice and mice lacking TLR2 and/ or TLR4. The average number of cells positive for CD3, FOXP3, or myeloperoxidase from at least five high power fields (HPF, 400×magnification) per animal were determined microscopically in immunostained colon sections of wt mice (WT), and animals lacking TLR2 (TLR2-/-), TLR4-/- (TLR4-/-), or both (TLR2/4-/-) at day eight after DSS-treatment for seven days (C, grey circles). Healthy animals served as controls (H, white circles). The numbers of analyzed animals are given in parenthesis. Mean values (black bars), and significance levels (as compared to wt animals with colitis) determined by Student's t-test are indicated (*, P<0.05; **, P<0.01; ***, P<0.001).

