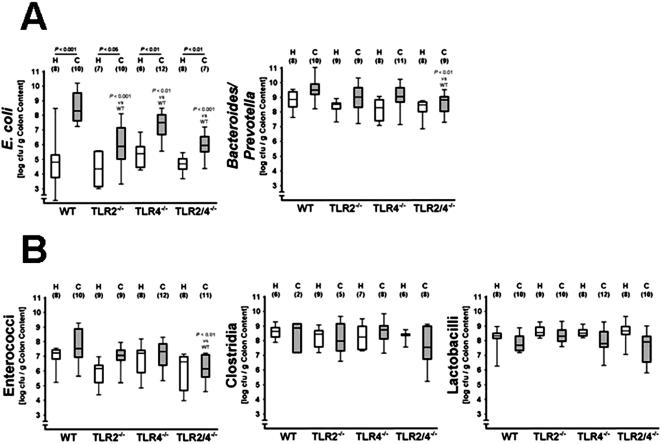
Figure 5. Cultural analysis of gut flora changes in healthy and diseased TLR2-/-, TLR4-/-, and TLR2/4-/- mice, as compared to wt controls.
Bacterial counts of (A) Gram-negative (E. coli, Bacteroides/ Prevotella spp.) and (B) Gram-positive bacteria (Enterococcus spp., clostridia and lactobacilli) in luminal colon contents from healthy animals (H) and from mice with colitis at day eight after DSS-treatment for seven days (C) as determined by culture. Bacterial species were identified by biochemical analysis and reconfirmed by comparative sequence analyses of 16S rRNA genes. Results are shown for wt mice (WT, above) and for mice lacking TLR2 (TLR2-/-), TLR4 (TLR4-/-), or both (TLR2/4-/-) as indicated on the x-axis. Animal numbers analyzed are given in parentheses. The data sets were pooled from two independent experiments. The boxes represent 75th % and 25th % percentiles of medians (indicated by black bars within the boxes. Maximum and minimum values are indicated by lines above and below boxes, respectively. Significance levels were determined by Mann-Whitney-U-Test. Underlined P values shown in black were calculated from comparisons of healthy versus diseased animals. P values shown in grey were calculated from the bacterial number in diseased animals (all versus WT).

