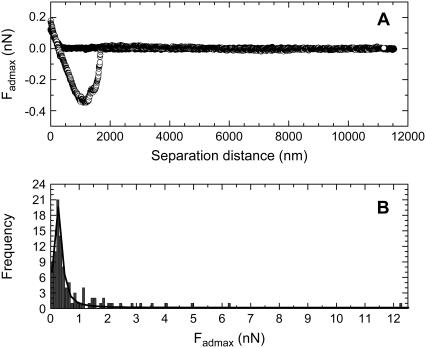
FIGURE 5.
The force curves measured between a PEG113 modified particle and living B16F10 cells, where (A) is a typical force curve and (B) is the histogram showing the frequency versus Fadmax data that was determined from the 100 force curves measured between PEG113 modified silica particles and 100 living cells.

