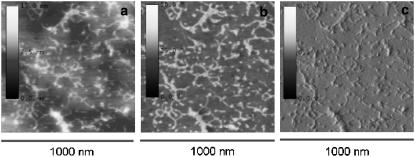
FIGURE 1.
AFM images for the P(EA-co-HEA) 50:50 copolymer scanned on a very smooth area of the sample (Rmax = 2.8 nm, RMS = 0.3 nm). The three characteristic magnitudes of the tapping mode were taken simultaneously: height (a), phase (b), and amplitude (c). The image shows that the phase mode is able to reveal the conformation of the protein on the substrate as compared both with the height and amplitude magnitudes.

