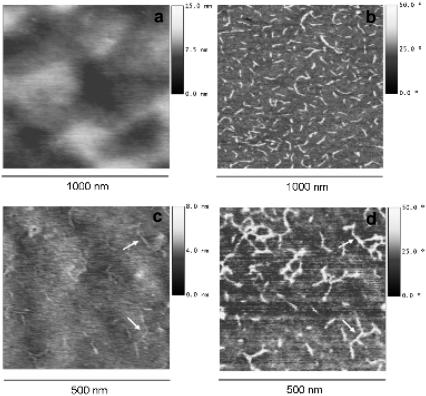
FIGURE 2.
AFM images for the P(EA-co-HEA) 70:30 (a,b) and the 50:50 copolymers (c,d). The height image (left) shows a uniform surface in the 15 nm scale (a) and some evidence of the adsorbed protein (c), note the small arrows. The phase image (right) shows laminin adsorbed on the substrate. The maximum height scale is 15 nm, the scanned area is 1 × 1 μm.

