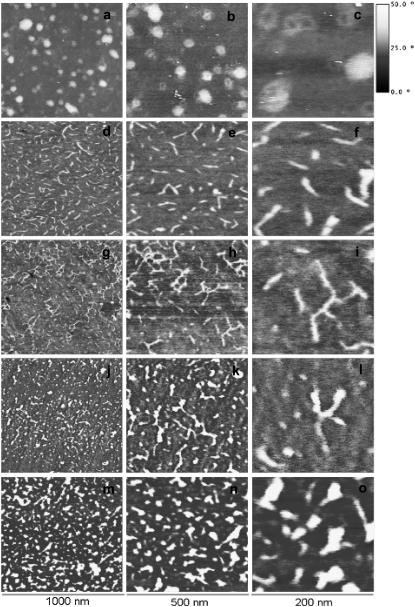
FIGURE 3.
AFM phase images of laminin on the different copolymers at different magnifications. (a–c) PHEA homopolymer; (d–f) P(EA-co-HEA) 30:70; (g–i) P(EA-co-HEA) 50:50; (j–l) P(EA-co-HEA) 30:70; and (m–o) PEA homopolymer. The first column shows 1 × 1 μm, the second column shows 500 × 500 nm and the third one 200 × 200 nm. The vertical scale is the same for all images.

