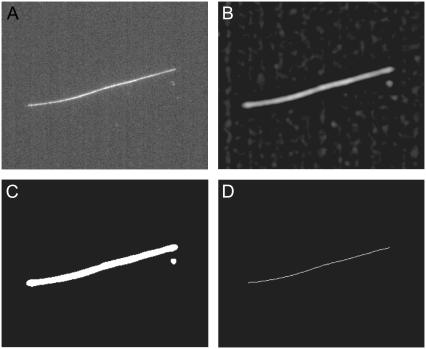
FIGURE 1.
Example of the initial image processing stages of the filament localization algorithm for a typical fluorescence micrograph of an Alexa-488 dye-labeled microtubule constrained to move in a quasi-two-dimensional chamber. (A) Unprocessed image, and image after bandpassing, as in Eq. 1 (B), followed by thresholding (C), and skeletonization (D). Note that the spurious speck in the thresholded image is eliminated upon skeletonization.

