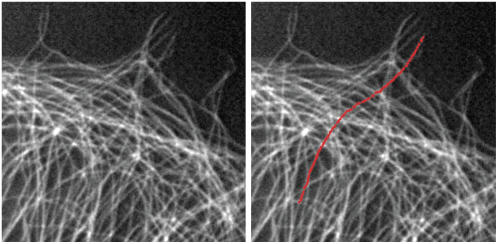
FIGURE 10.
Fluorescence image of a monkey kidney epithelial cell that has been fixed and stained, showing microtubules near the cell edge. We track one microtubule by combining the automated filament tracking algorithm with a manual initial filament identification. On the right is the fluorescence image with the filament coordinates overlaid in red.

