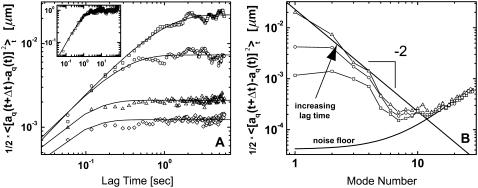
FIGURE 6.
(A) Time dependence of the mean-square amplitude of Fourier coefficients  of the first four bending modes of a 30-μm -long microtubule, with fits to Eq. 6. (Inset) Note that data scale together when plotted as a function of the scaled variables
  and t/τ. (B) Mean-square amplitudes of the Fourier coefficients
  plotted as a function of mode number n, for increasing lag times Δt = 0.059 s, 0.0177 s, and 5.9 s. At longer lag times, the variance of the amplitude for the first few modes approaches the expected q2-dependence of Eq. 6, with a persistence length of 4 mm (decreasing solid line). At higher mode numbers, the amplitudes are dominated by a RMS noise of 0.15 pixel (increasing solid line).

