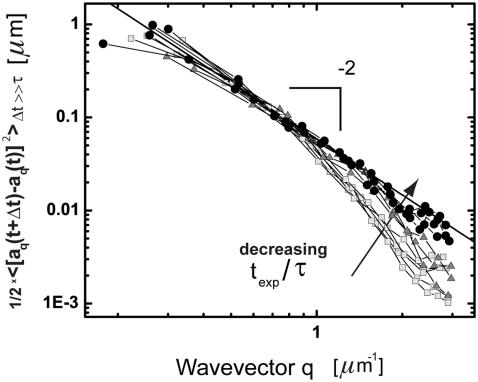
FIGURE 7.
Saturation values of the mean-square amplitudes of the bending modes of 12 actin filaments imaged using different ratios of exposure time to mode relaxation time. Light gray squares were imaged with 100 ms exposure in aqueous buffer, gray triangles were imaged with 100 ms exposure time in a viscous background solution. Black circles were imaged with 5–10 ms exposure time using TIRF illumination. The onset of deviation from q2-scaling (black line, slope 1/lp = 17 μm) corresponds to wavevectors for which the relaxation time roughly equals the exposure time; fluctuations for larger wavevectors are blurred and register as smaller values.

