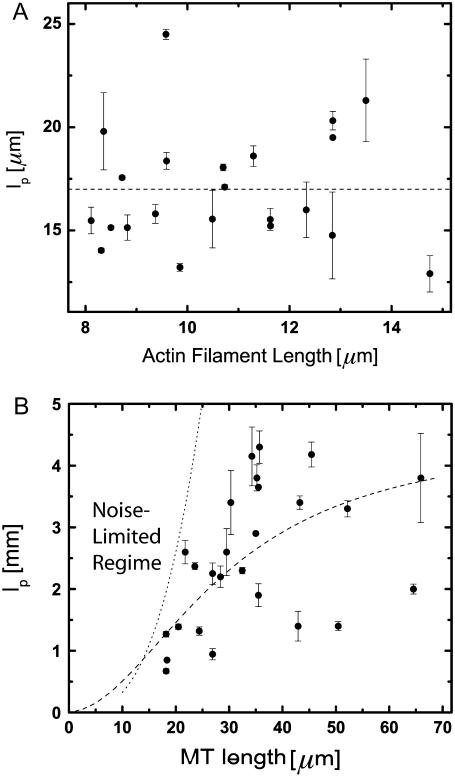
FIGURE 8.
Persistence length of 22 actin filaments and 26 microtubules plotted as a function of filament length. (A) Actin filaments show a relatively narrow distribution of persistence lengths with an average  μm (dashed line). There does not appear to be any dependence on filament length over the range studied. (B) Microtubules display a broader distribution of persistence lengths, and there is an apparent small correlation between the bending rigidity and filament length, with shorter filaments appearing softer. Our data can be fit to a length-dependent expression for the persistence length,
  with
with  and
and  as shown by the dashed line (15). However, the dotted line, denoting a conservative estimate of the intrinsic noise limitations, suggests that this correlation may only reflect a noise limitation.

