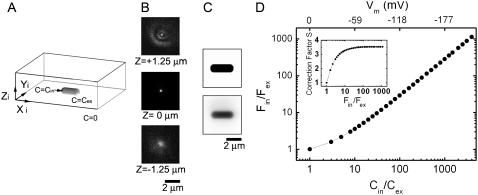
FIGURE 1.
Calculation of the correction factor for convolution of the dye distribution with the microscope PSF. (A) Model of the dye distribution for a bacterium attached to a glass coverslip. (B) Cross sections of the measured PSF at different values of z. (C) Dye distribution at midcell height (upper) and the corresponding image after convolution (lower). (D) The calculated fluorescence intensity ratio, Fin/Fex, versus the concentration ratio, Cin/Cex. The correction factor, S(Fin/Fex) = (Cin/Cex)/(Fin/Fex), is also shown (inset). Fluorescence intensities were calculated from the convoluted image as described in the text.

