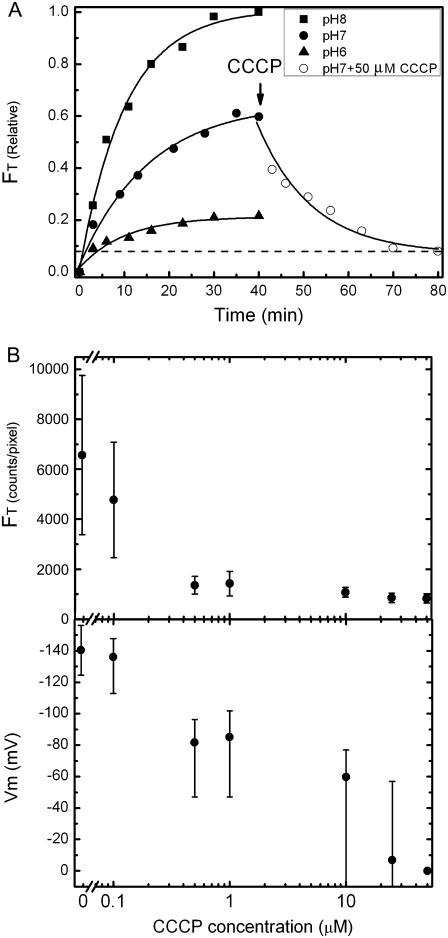
FIGURE 2.
(A) Total fluorescence intensity (FT) of cells versus loading time with 0.1 μM TMRM in sodium motility buffer at different pHex (solid symbols), and after treatment with 50 μM CCCP at pHex = 7 (open circles). Lines are exponential fits, FT = A0 + A1exp{−t/t0}, time constants t0 are given in the text. Each point is the mean of measurements of 10 cells. (B, upper) FT versus CCCP concentration. Cells were loaded with TMRM for 40 min and fluorescence measurements were made 40 min after addition of CCCP. Mean ± SD of 30 cells is shown. (B, lower) Vm calculated from the data in the upper panel using the method described in the text.

