FIGURE 2.
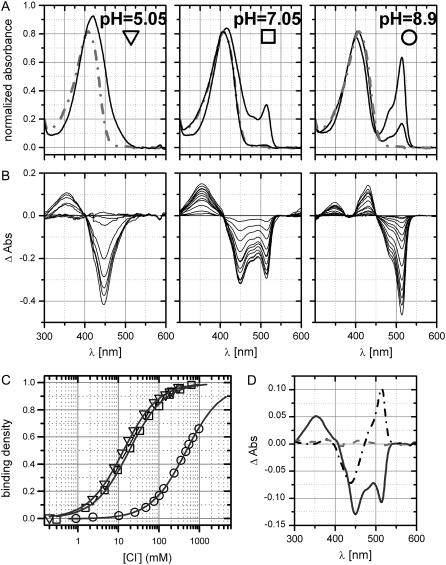
(A) E2GFP absorption spectra (normalized at 278 nm) at the three pH values: 5.05, 7.05, and 8.9 (from left to right) and increasing NaCl concentration (up to 1 M). Spectra at intermediate chloride concentration were omitted for graphical clarity. The spectrum collected at pH 5.05 and ∼400 mM NaCl is highlighted (shaded dash-dot line) in the left panel and overlaid (shaded dash-dot line) on the other two right panels. (B) Difference spectra corresponding to data of panel A. (C) Binding density derived from SVD analysis of the spectra reported in panel B. The solid lines show the fitting to the 1:1 binding model (Eq. 1) with fit parameter kd = 13.4 ± 0.2, 18.6 ± 0.8, and 478 ± 13 mM for pH = 5.05, 7.05, and 8.9, respectively. (D) First three basis difference spectra obtained by SVD analysis applied over all datasets reported in panel B. The first (solid), second (dash-dot), and third (shaded dash) basis vectors are weighted by the corresponding singular values: 7.7, 4.9, and 0.4.

