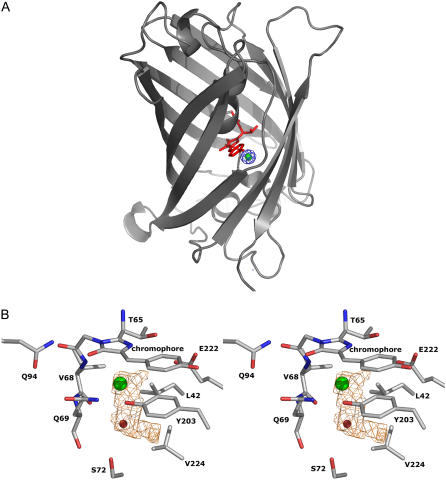
FIGURE 8.
(A) Ribbon representation of the E2GFP·Cl− complex crystal structure. The chromophore is shown in stick representation and colored in red. The 2Fo-Fc electron density map at 5δ corresponding to the area where the chloride anion was modeled, is in blue. The phases were calculated from a refined model lacking the chloride ion. The refined bonded chloride anion has been superimposed and represented as a green sphere. (B) Stereo-view of the chromophore region of E2GFP·Cl− complex. The chloride ion and water molecule Wat252 are represented as green and red spheres, respectively. The volume (≈10 Å3) of the halogen-binding cavity is represented in orange.

