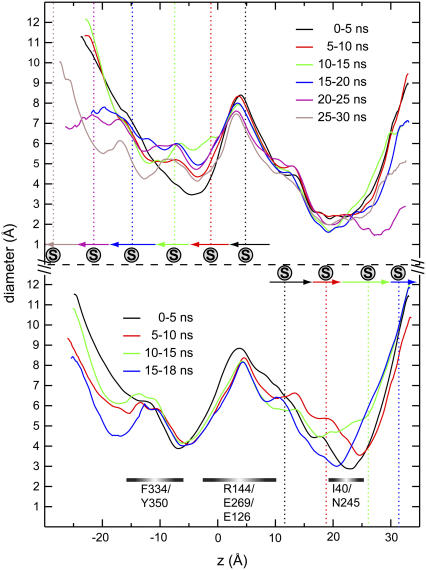
FIGURE 4.
Lumen diameters of LacY(269H/325−) calculated using HOLE (57). The diameters represent mean values of 500 configurations separated by 10 ps and belonging to 5-ns time windows. Upper and lower panels present probing of protein conformational changes induced in response to sugar movement toward cyto- and periplasm, respectively. Mean sugar positions within each time window are delineated by vertical dashed lines. Horizontal arrows indicate overall sugar displacement within each time window according to Fig. 3.

