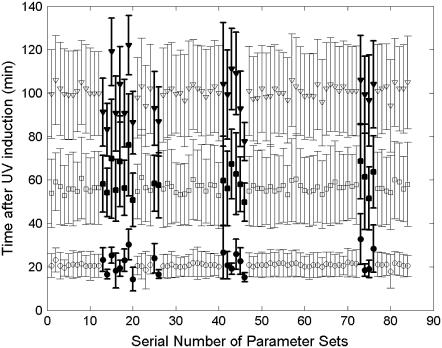
FIGURE 10.
Parameters analysis for peak position distributions. For each parameter set, recA mRNA dynamics is counted in 100 runs, UV dose = 50 J/m2. The cutoff frequency is 30 min−1. The average of first (circle), second (square), and third (triangle) peak positions of the recA mRNA profile are shown. The ones that are different from the majority are highlighted in solid. Error bars are the mean ± SD of the peak positions.

