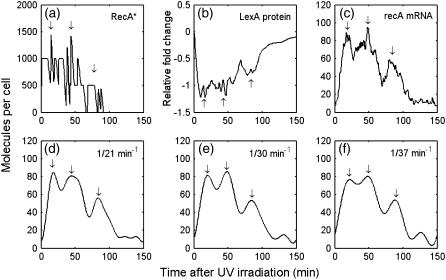
FIGURE 5.
Illustration of the recA mRNA modulation, a case study (a) RecA* level; (b) LexA protein relative level; (c) recA mRNA level; (d–f) filtering (c) with a cutoff frequency of 21 min−1, 30 min−1, 37 min−1, respectively. The six subgraphs are from a single simulation in UV dose = 50 J/m2. Arrows denote the peak position.

