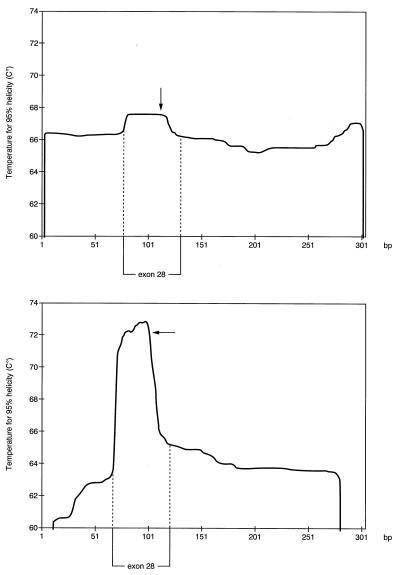
Figure 3.
Melting profile for a PCR product containing sequences for exon 28 of the COL3A1 gene. (Upper) Melting profile after addition of 10-bp GC clamps to the 5′-end and 3′-end of the product. (Lower) Melting profile for the native sequence without GC clamps. Arrows indicate the site of a single-base mismatch.

