
Fig. 7.
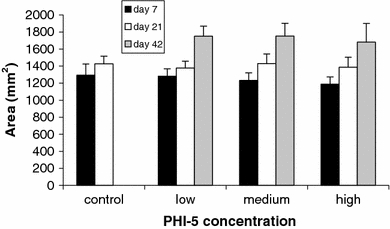
Mean Reference Surface Area (RSA). In all groups, the RSA significantly expands over the days. Note also the trend of a smaller RSA with an increasing concentration of PHI-5 on day 7. These differences resemble those of the WSA, although here are not significant. Bars indicate SD