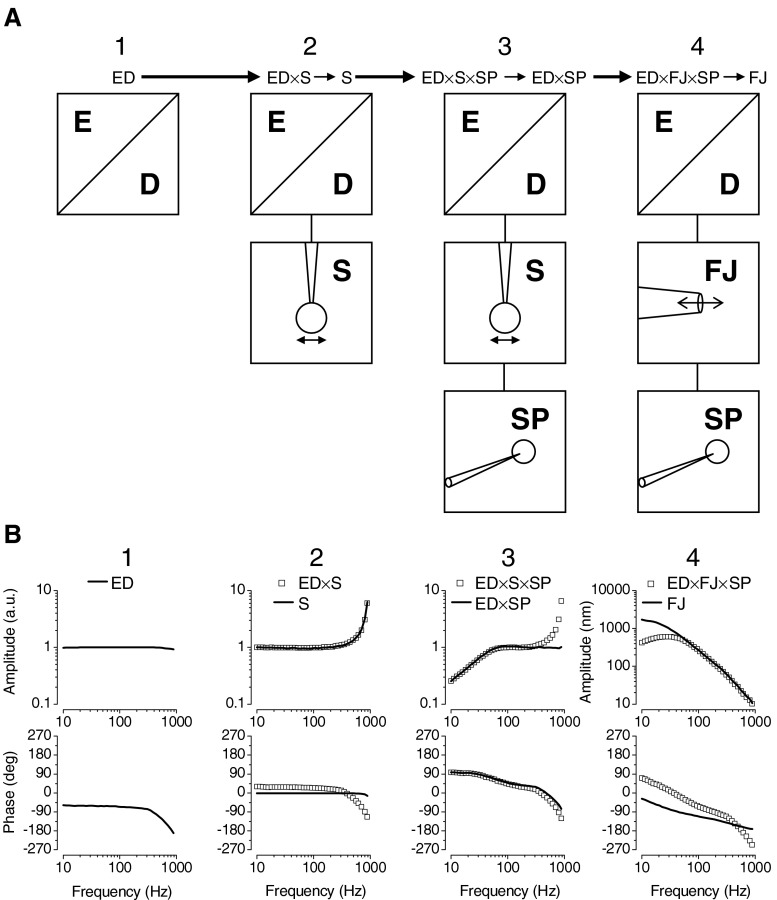
FIG. 4.
Schematic representation of the fluid jet correction procedure. A Each column (1–4) represents a type of measurement needed to complete the correction. The frequency responses measured with the sense probe contain frequency-dependent properties of ED (equipment, demodulator), S (stimulus sphere), SP (sense probe), or FJ (fluid jet) as a function of frequency. Results represented in a column are used to correct the measured response in the next column, indicated by the long arrows and produce results pointed at with a short arrow. B Displacement amplitude and phase for each measurement (1–4) described in (A). Each solid line is the result of a correction (except for column 1) and is used in the next column to correct the measured frequency response (symbols), both for the amplitude and the phase response.

