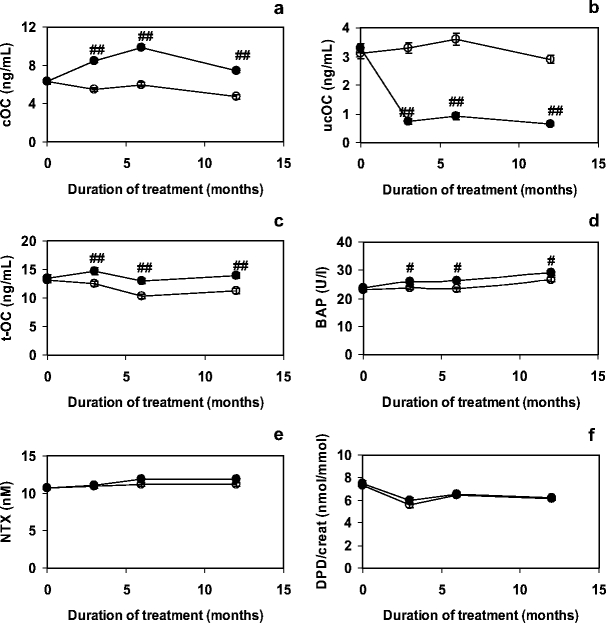
Fig.1.

EffectofMK-4 on markers for bone metabolism during the first year of treatment. Bone formation markers are presented in graphs a–d (cOC, ucOC, tOC and BAP, respectively) and bone resorption markers in graph E and F (NTX and DPD/creat respectively). Closed symbols: MK-4; open symbols: placebo. Error bars represent SE. Significance of differences MK-4 compared to placebo: #: p < 0.05; ##: p < 0.005
