
Fig. 1.
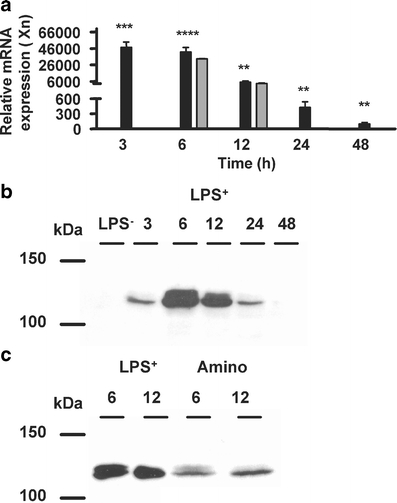
iNOS mRNA and protein. a iNOS mRNA expression in rat kidney at different time points after LPS+ was determined with RQ-PCR without (closed bars, n = 6) or with coadministration of aminoguanidine (gray bars, n = 6). The iNOS mRNA expression was normalized for the GAPDH CT value (16.06 ± 0.04, n = 15), and ΔCT values for the LPS− were set to 1. Data are expressed as mean±SE. Significantly different compared to the LPS− (double asterisksP < 0.01, triple asterisksP < 0.001, quadruple asterisksP < 0.0001). Cytosolic fractions of rat kidney were isolated and expression of iNOS was determined by Western blotting. Representative images (n = 4) show maximal iNOS protein expression 6 h after LPS+ administration (b), and coadministration with aminoguanidine reversed this induction (c)