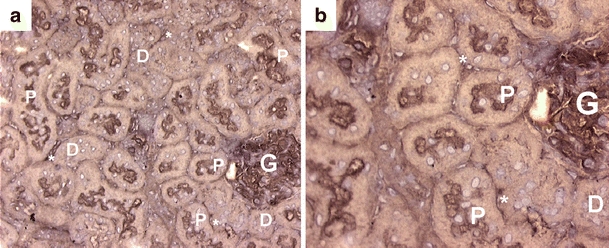
Fig. 7.

Distribution of Abcb11/Bsep in rat kidney cortex. a, b Representative immunohistochemical images show apical staining in proximal tubules (indicated by arrows). In addition, glomerular and peritubular staining of Bsep in the cortex was found. G glomerulus, asterisks peritubular staining, P proximal tubule, D distal tubule. Original magnification in a ×200, and in b ×400
