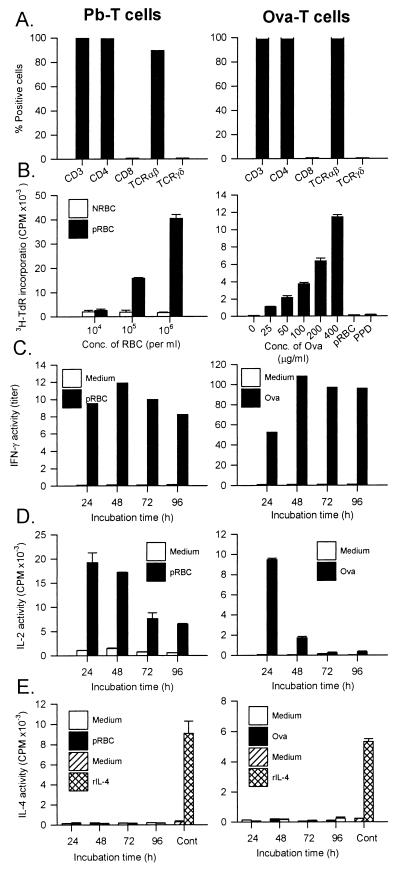
Figure 1.
Characteristics of P. berghei- or Ova-specific T cell lines, showing cell surface phenotype (A), proliferative response (B), IFN-γ (C), IL-2 (D), and IL-4 production (E). Data show mean ± 1 SEM for cell proliferation and IL-2 and IL-4 production. The activity of IFN-γ is shown as a titer, as determined by calculating the dilution that gave 50% inhibition of WEHI-279 cell proliferation. The concentration of antigen used to stimulate cytokine production was 106 pRBCs per ml or Ova at 200 μg/ml. The concentration of IL-4 used in the positive control was 400 units/ml, and the sensitivity of the cells in this assay was 3.125 units/ml.

