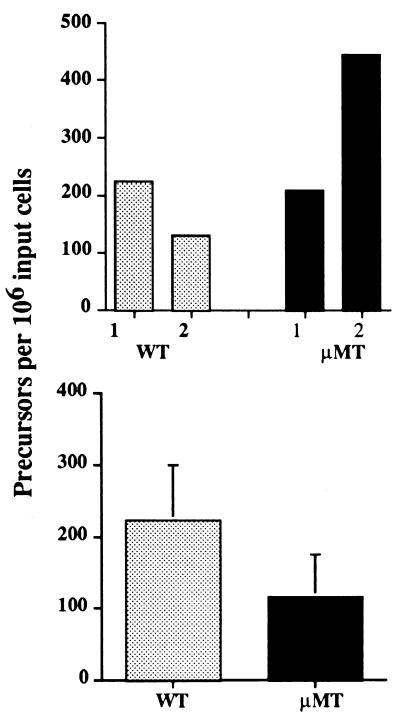
Figure 2.
Precursor frequency analysis of CD4+ T cells from P. chabaudi-infected WT (□) and μMT (▪) mice able to proliferate in response to malarial Ags in vitro. The data are expressed as precursor frequencies, calculated as described in text. (Upper) At 8 days of infection. The bars show the responses in 2 experiments, each performed with a pool of cells from 2 mice. (Lower) At 30 days of infection. The bars represent the mean precursor frequencies obtained in 6 independent experiments. The standard errors of the mean are shown.

