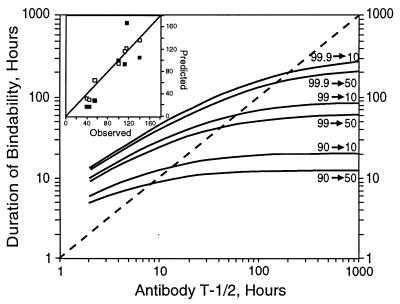
Figure 5.
Predicted bindability duration with continued sTac production. Six curves based on Eq. 3 and c = 0.1 (q = cB0) are indicated as a function of antibody t1/2: 90 → 50 and 90 → 10, time for A90 dose to reduce to 50 and 10% bindability; and similarly for A99 and A99.9 doses. Dashed line separates curve segments for bindability durations exceeding (above) or less than (below) one antibody half-life. Inset: Observed vs. predicted duration to 10% bindability postinfusion. □, based on individual measured rates of q by Eq. 5; ▪, based on assumption of a uniform value of c = 0.1 for all subjects. Seven doses in six patients allowed estimation of hours to 10% bindability.

