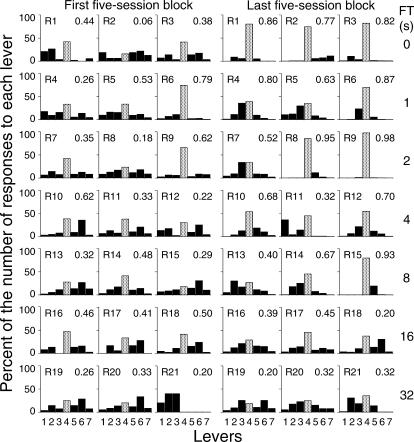
Fig 3. Presses on each lever as a percentage of the overall number of responses on the seven levers for the 3 subjects exposed to each FT schedule.
The data are from the first and the last blocks of five sessions. The A coefficient was calculated as a measure of response variability and is shown at the upper-right corner of each panel. The dotted bar represents the operative lever.

