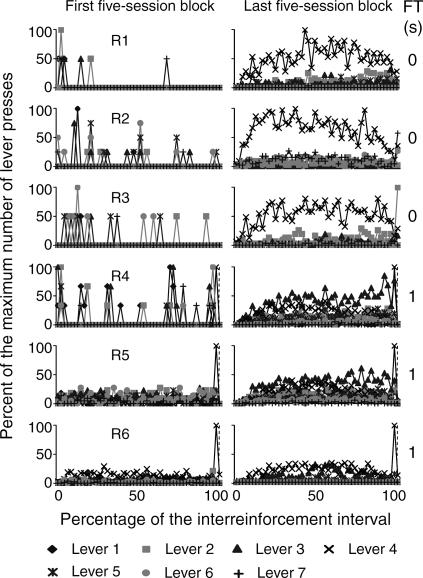
Fig 4. Temporal distribution of presses on the seven levers as a percentage of the IRI for the two groups of subjects exposed to the FT 0-s and FT 1-s schedules during the first and the last five-session blocks.
The RI distribution was calculated from the preceding reinforcer to the onset of the FT interval. The FT distribution was calculated from the onset of the FT interval to the delivery of the reinforcer. The last response in the RI component was eliminated from the analysis. The beginning of the reinforcer delay (the FT period) is marked with a dashed vertical line. FT schedule values appear at the far right in each panel.

