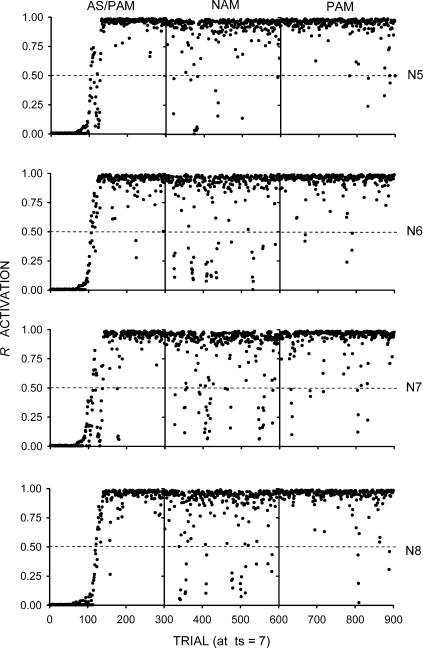
Fig 4. Results of Simulation 2.
The rows represent the individual networks (labeled as N5, N6, N7, and N8). Each network was given a sequence of three phases, represented by the columns labeled as AS/PAM (autoshaping/positive automaintenance), NAM (negative automaintenance), and PAM. The dots represent R activations at ts = 7 (the moment before reinforcement). The dashed lines mark the R activation criterion for sensory feedback from responding.

