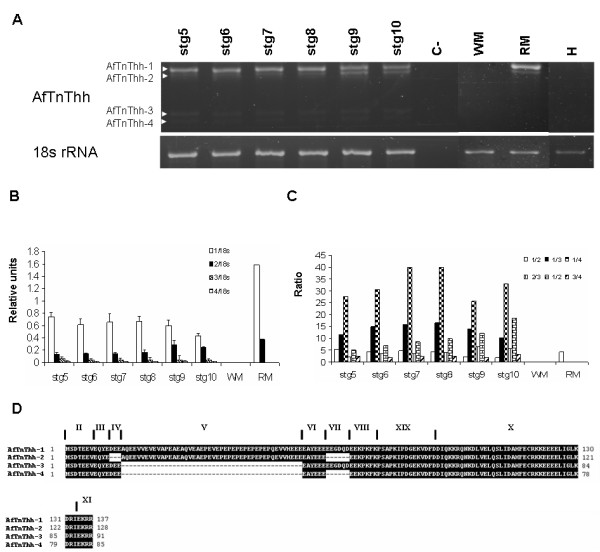
Figure 6.

Expression of AfTnThh gene during halibut metamorphosis; Ethidium bromide gel image of AfTnThh and 18s rRNA (A). C- represents none-template control. White arrowheads indicate the different AfTnThh isoforms found. Graphs present the expression of the different AfTnThh isoforms relative to 18s rRNA(B) and the ratio between the different AfTnThh isoforms (C). The predicted protein sequence of the amplified halibut AfTnThh isoforms is given (D). The exons that encode each peptide are also indicated.
