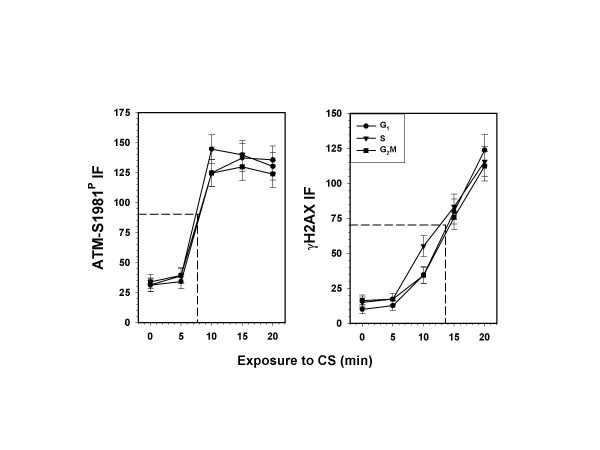
Figure 2.
IM16 CS-dose (time of treatment) dependence in induction of ATM-S1981P and γH2AX for A549 cells at different phases of the cell cycle. The mean values of ATM-S1981P and γH2AX IF for populations of G1, S, and G2M cells (± SEM) from the mock-treated sample (0 min) and from the samples treated for 5, 10, 15 and 20 min with CS, were estimated by gating analysis on the bivariate distributions as shown in Fig. 1. The mid-slope points are projected on the CS dose (time of exposure) coordinate. It should be noted that similar curves of γH2AX IF, determined under identical conditions, were previously published [35]. The present curves for γH2AX IF, though virtually identical to the previously published data, represent new sets of slides in which γH2AX IF was measured in one chamber while ATM-S1981Pwas measured in the second chamber of the same slide.

