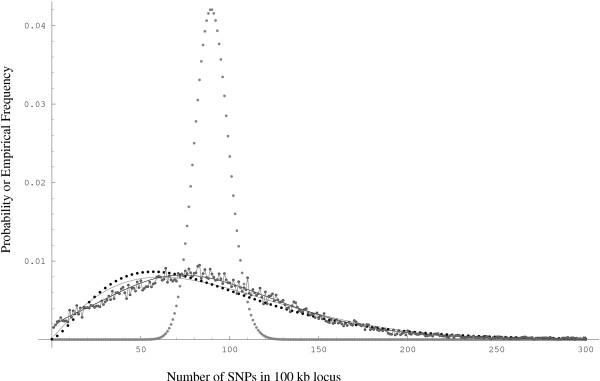
Figure 1.

Fits of the homogeneous Poisson model (large gray dots), hierarchical Poisson model A (black dots) with T ~ G(γ1, γ2) hierarchical Poisson model A' (gray line) with T = λ and Λ ~ B(β1, β2), and hierarchical Poisson model B (black line) with T ~ G(β1, β2) and Λ ~ B(β1, β2) to the observed SNP density distribution (joined gray dots).
