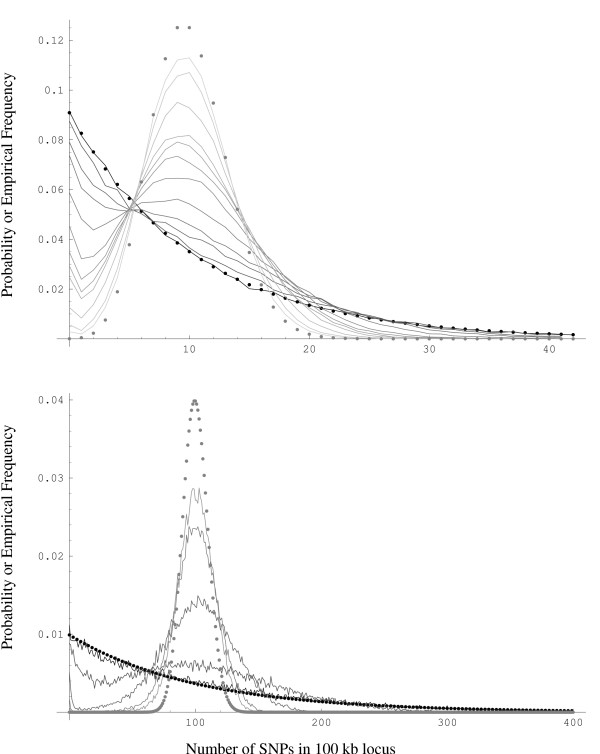
Figure 2.

The distribution of SNP density in 100 kb morphs from the geometric distribution (black dots) towards the Poisson distribution (gray dots) as the scaled recombination rate ρ increases from 0 to 1000 in decreasing shades of gray for θ = 10 (top) and θ = 100 (bottom).
