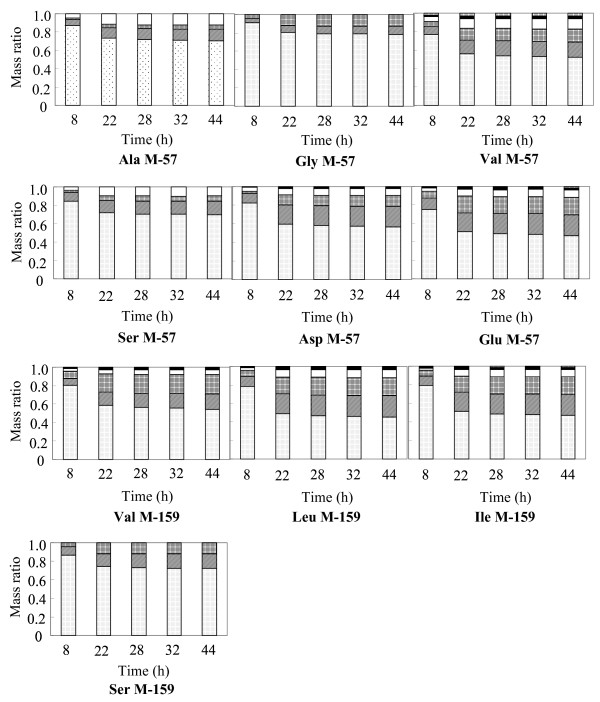
Figure 2.
Time courses of mass isotopomer distributions of proteinogenic amino acids in fermentation after addition of 13C-labeled glucose, where glutamate production was 20 with respect to glucose uptake of 100. The data (m0, m1 ..., mn indicating the mass isotopomer distributions obtained from mass spectral intensity ratios, as previously described [22]) at each sampling time were summed up to unity from the bottom. Time indicates that after 13C glucose addition. The M-57 and M-159 of each amino acid indicate mass ion fragment groups with high intensities, and thus, these data were used for 13C MFA.

