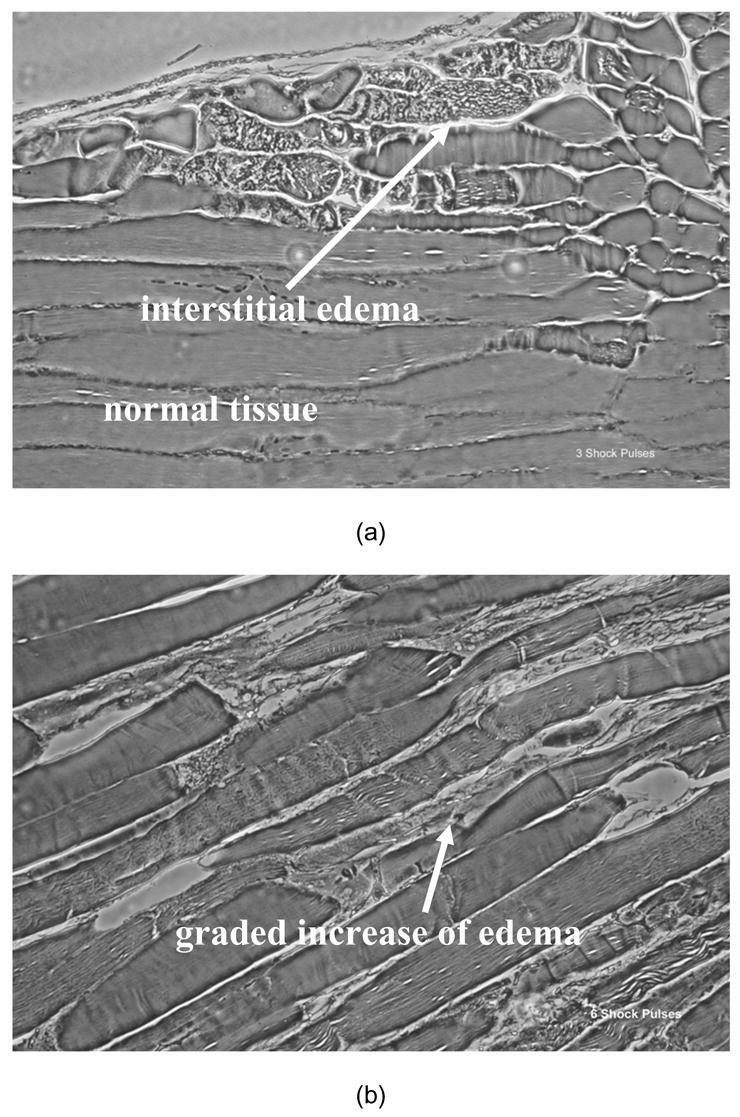
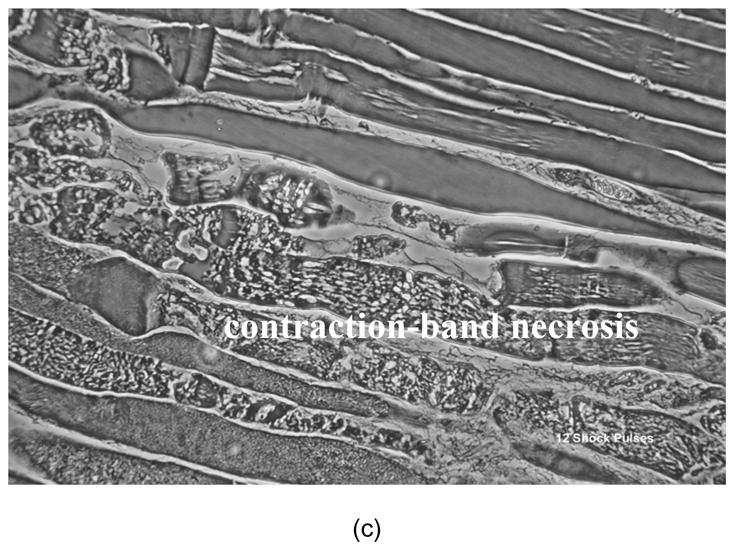
Figure 2.


Representative phase contrast photomicrographs (40x) of H&E stained 7 μm sections of electrically shock biceps femoris muscles are shown. Electroporation damage is distributed very non-uniformly in each muscle reflecting the stochastic nature of electroporation. The more shocks the more severe and the more uniform the damage. Longitudinal sections from muscle exposed to (a) 3 shock pulses exhibit a low percentage of damaged cells with mostly normal cytoskeletal architecture and some interstitial edema; (b) muscles subjected to 6 shocks manifest damage to 20–30% of the cells with more edema and (c) muscle subjected to 12 shocks have marked "contraction-band necrosis" to most cells and severe edema. Biopsies were taken 6 hours after electrical shock.
