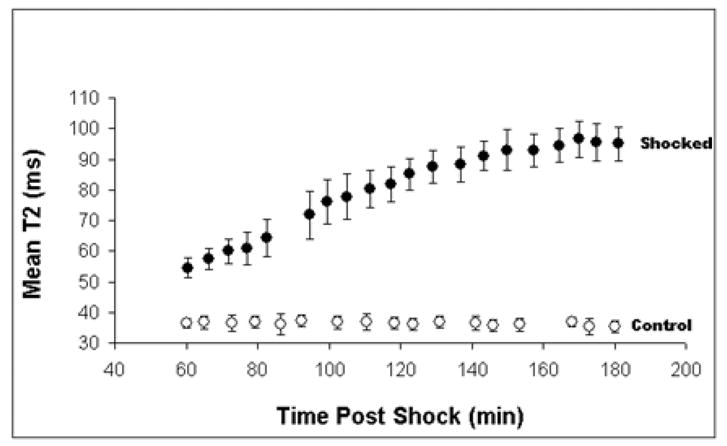
Figure 3.

Plot characterizing the development of edema injury over time. A 5 x 5 mm ROI was selected, and mean T2 values in a shocked leg (closed circles, ± SD, n = 25 pixels) and non-shocked leg (open circles, ± SD, n = 25 pixels) as a function of time after electroporation. In this case lactated ringers was used as treatment and injured tissue was followed over time
