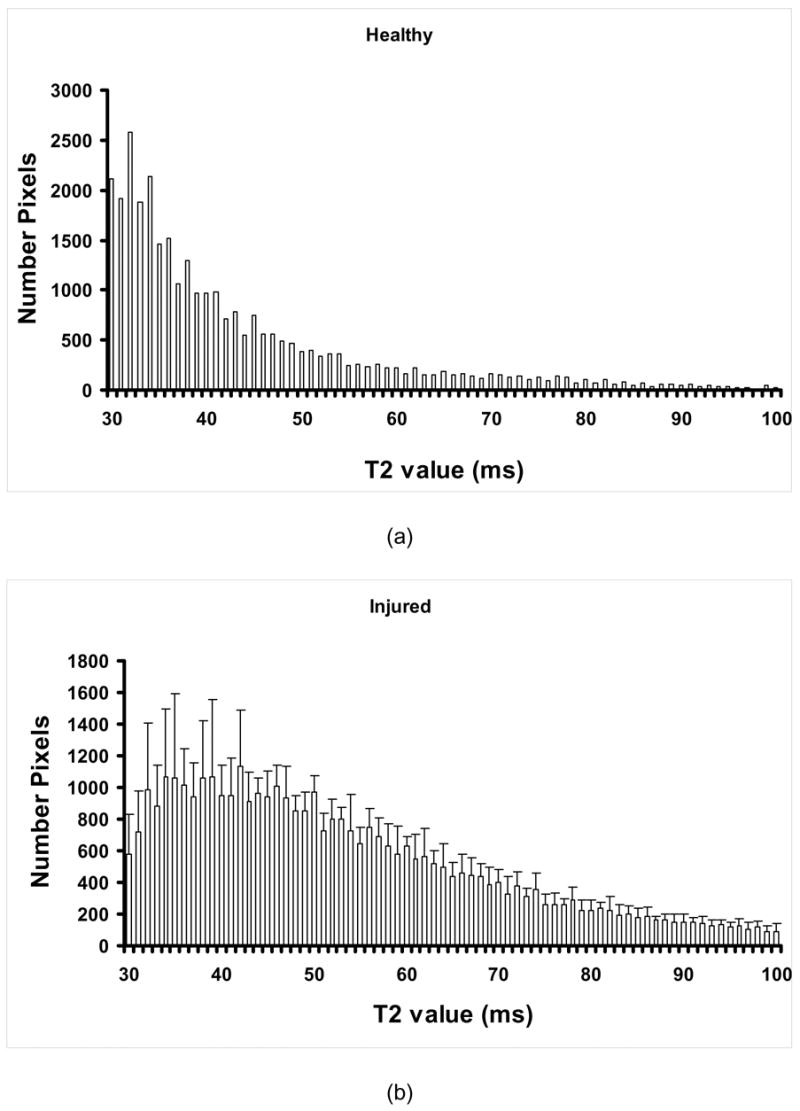
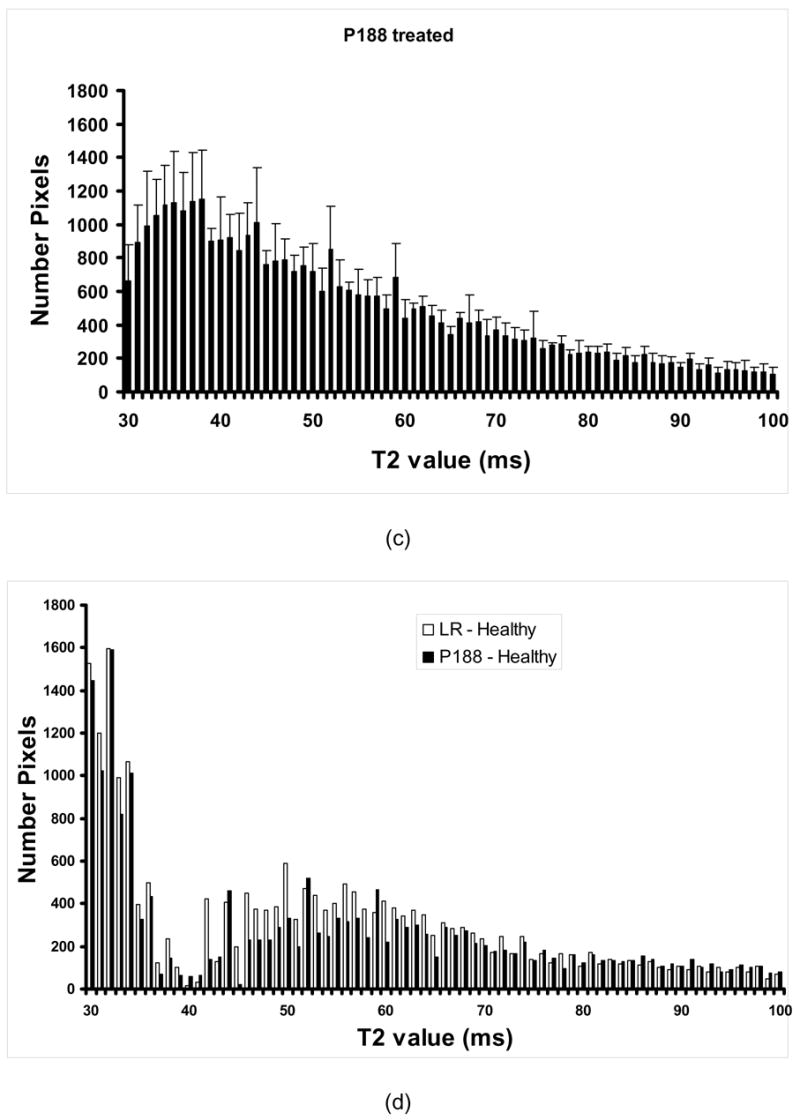
Figure 6.


Average number of pixels for each T2 value in the interval 30–100 ms for healthy (a) LR-treated (b) and P188-treated (c) rats; In (d), we can see the difference in the magnetic signal intensity distribution between P188-treated and healthy rats (bright) and between LR-treated rats and healthy rats (dark) suggesting the evolution of the volume of injury (n = 5).
