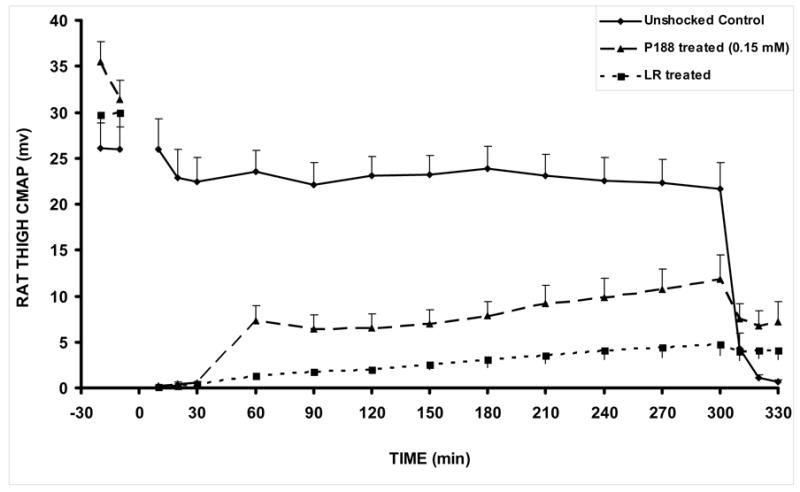
Figure 7.

CMAP amplitudes in control, shocked (LR-treated), and shocked P188-treated rats. At 5h, the sciatic nerve is blocked with lidocaine to verify that CMAP is nerve stimulated. The unshocked contralateral control leg CMAP values were not significantly different between LR-treated and P188-treated groups, so control data was obtained from the LR-treated group as shown. Unshocked Control (n=8), P188 treated (n=3), LR treated (n=8). All animals received 9 shocks. All values are shown as mean +/− SEM. p = 0.0270. This is the two tailed p value calculated from an unpaired t-test at the 300 minute time point, comparing shocked P188 treated to shocked LR treated.
