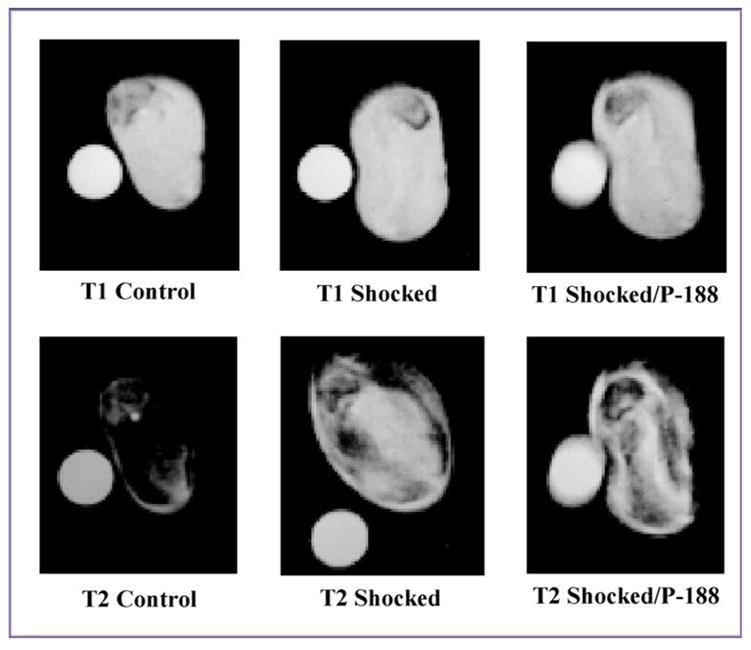
Figure 8.

The greyscale contrast for characteristic T1 and T2 - weighted MRI images of control (left), injured (middle) and P188 treated (right) muscle samples suggesting the recovery of the water balance across the plasma membrane after the treatment with P188. One can observe that the grey level characterizing the magnetic signal of water in P188 treated muscle samples is approaching that corresponding to the control muscle samples. The parameters for recording T1 - weighted MRI images were TR = 400 ms and TE = 5 ms. T2 - weighted MRI images correspond to TR = 2s and TE = 60 ms.
