
Figure 6.
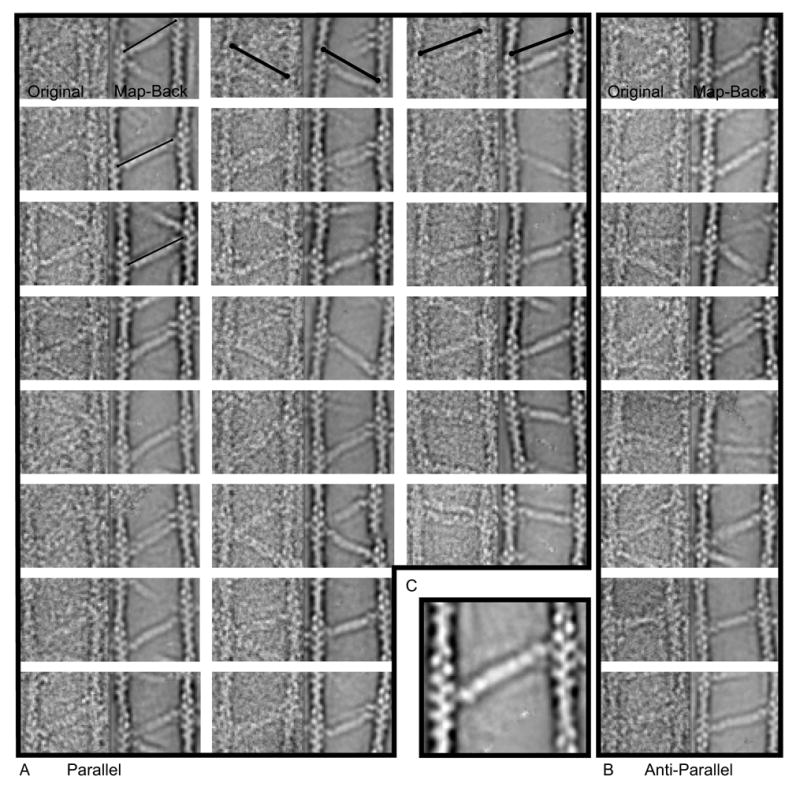
Mapped-back images. A and B represent direct comparisons of the raw image cross-link on the left and the re-assembled cross-link placed into the original coordinates for both (A) parallel and (B) antiparallel cross-links. Each half of the cross-link is contributed by a different class average. Each panel is 157 × 78.5 nm. The thin lines in the first column are all the same fixed length and illustrate the variation in total length of the α-actinin cross-link. The heavy lines in the first row are the same length in each panel and illustrate that the reassembled averages have identical positioning to the original motif which validates our use of these averages for measurement. C, Enlarged view. One can almost discern the four spectrin repeats in the rod domain, the CaM domain density, and a tiny nub of density nestled between the actin monomers attributable to the ABD.