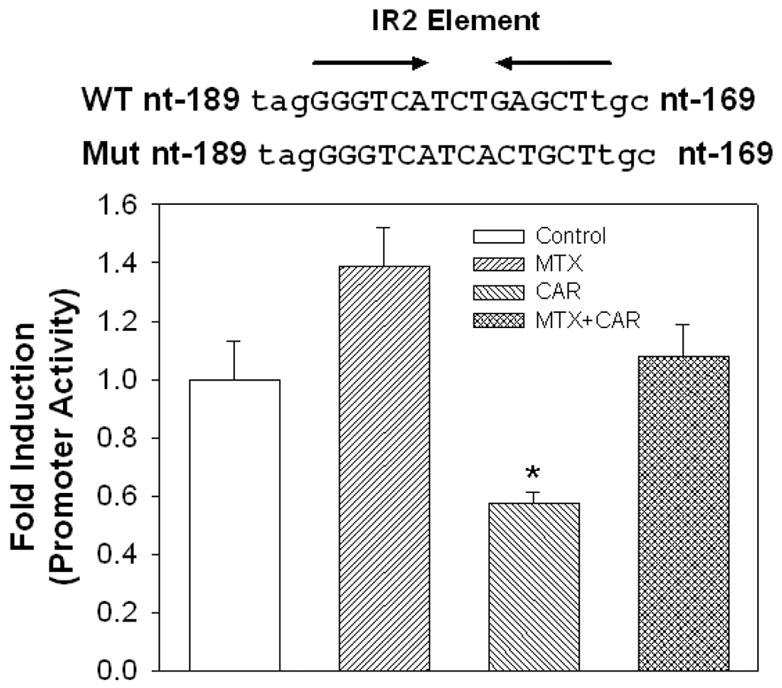
Figure 5. Point mutation analysis of the IR2 DNA cis-element.

Mutated 5′-flanking region of hSULT2A1 (−414 to +48) as shown in the figure was inserted into pGL3-Basic vector. Luciferase expression regulated by this mutated promoter was determined in Caco-2 cells. The histograms are average values from three independent experiments (each performed in duplicate). ANOVA/Dunnett’s test was used in the data analysis, *, p < 0.05 compared with control.
