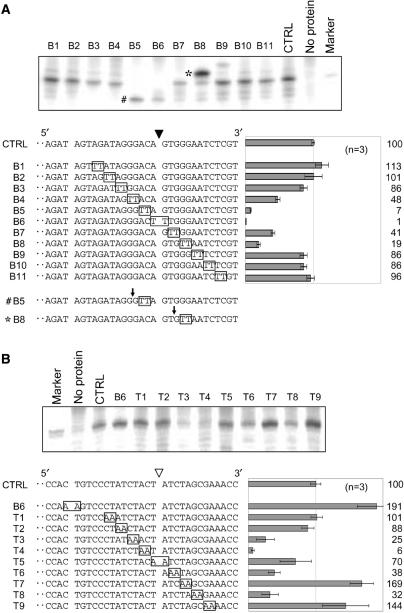
Figure 2.
Identification of sequences involved in the cleavage of the target sites. Nicking activities of the target sites on mutated substrates were examined (A, bottom strand cleavage; B, top strand cleavage). Mutated substrates contained TT or AA substitution (boxed) and a mutated position of the substrates was sequentially changed. Each substrate was numbered and CTRL represents a non-mutated control substrate. Nicked strands of mutated substrates are shown at the lower left of each panel and mutated bases were boxed. The solid and open arrowheads indicate the cleavage sites on the top and bottom strands, respectively. Three picomoles (for bottom strand cleavage) or 1 pmol (for top strand cleavage) of the mutated substrate was incubated with R1EN and electrophoresed. Gel bands around the cleavage products were shown at the top of each panel. The size marker has the same sequence as the expected cleaved product. The cleavage products nicked at the target site were quantified and the percentage of the cleavage product relative to that of a control substrate was shown at the lower bottom of each panel. The results of three independent experiments were averaged and error bars show S.E.

