
Figure 3.
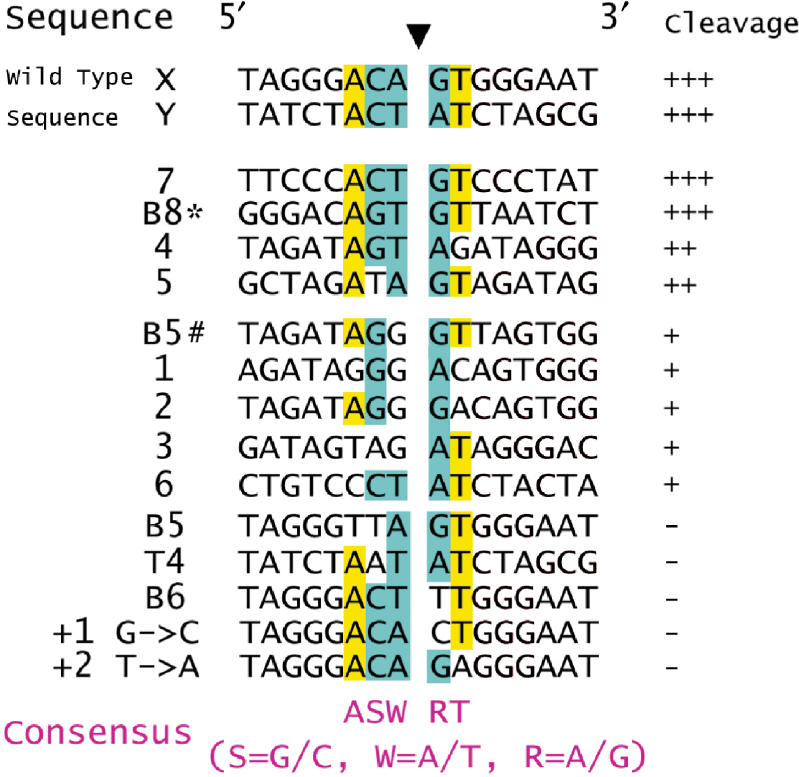
Sequence comparison of the cleavage sites of R1Bm EN. The cleaved sites shown in Figures 1 and 2 were classified into four classes (+++ >70%; ++ >50%; + >10%; − <10% of wild-type cleavage, respectively) according to the density of each band, and aligned by the cleavage site (filled arrowhead). The conserved bases among the substrates are highlighted with yellow (one base species) and cyan (two bases species).