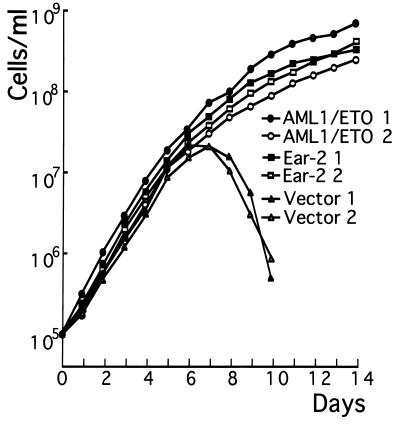
Figure 5.
Growth curve of 32Dcl3 cells in response to G-CSF. Approximately 1 × 10⁶ cells of ear-2 or AML1/ETO(MTG8)-expressing clones or those received only the vector growing in the presence of IL-3 were washed twice with PBS and cultured in the medium containing recombinant human G-CSF (500 units/ml). At each time point, viable cells excluding trypan blue were counted by using a hemocytometer. Two independent experiments were performed. ▪ and □, Ear-2 1 and Ear-2 2, respectively; • and ○, AML1/ETO(MTG8) 1 and AML1/ETO(MTG8) 2, respectively; ▴ and ▵, Vector 1 and Vector 2, respectively.

