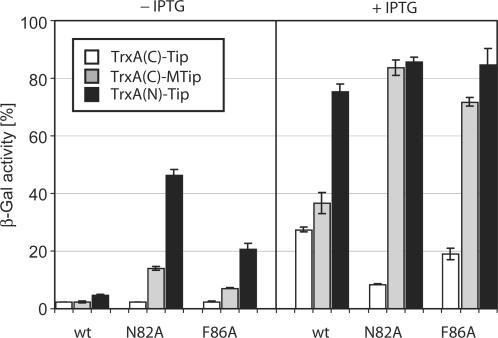
Figure 3.
Induction of TetR, TetR-N82A and TetR-F86A by C- and N-terminal TrxA-Tip fusions. The TetR variants are indicated below the bars and encoded by pWH527-derivatives. White bars show the activities induced by the C-terminal TrxA(C)-Tip fusion, gray bars those of TrxA(C)-MTip and black bars those of the N-terminal TrxA(N)-Tip fusion. The left side of the figure (labeled − IPTG) shows induction by basal expression levels while the right side (labeled + IPTG) shows the effects of induced (60 µM IPTG) expression of the Tip protein fusions.

