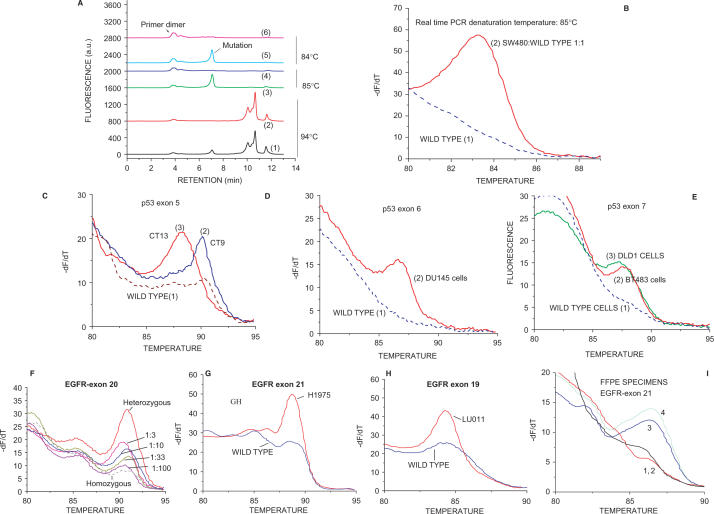
Figure 3.
Detection of p53 exons 5–9 mutations and EGFR mutations in clinical samples and cell lines. (A) dHPLC chromatograms of the s-RT-MELT p53 exon 9 products obtained using DNA from wild type cells, or a 1:1 mixture of SW480 and wild-type cells, at various real-time PCR denaturation temperatures. Curves 1 and 2: mutant and wild- type s-RT-MELT products, respectively, at 94°C; Curves 3 and 4: mutant and wild-type s-RT-MELT products, respectively, at 85°C; Curves 5 and 6: mutant and wild-type s-RT-MELT products, respectively, at 84°C. (B) Melting curves obtained following s-RT-MELT of p53 exon 9 at 85°C denaturation temperature for wild-type DNA, or a 1:1 mixture of SW480 and wild-type DNA. (C) Melting curves obtained following s-RT-MELT of p53 exon 5 for colon cancer surgical samples CT9, CT13 and wild-type samples, curves 2, 3 and 1, respectively. (D) Melting curves obtained following s-RT-MELT of p53 exon 6 using DNA from cell line DU145 and wild-type samples. (E) Melting curves obtained following s-RT-MELT of p53 exon 7 using DNA from mutant cell lines DLD1, BT483 and wild-type samples. (F) Melting curves obtained following s-RT-MELT of EGFR exon 20 for serial dilution of a DNA sample containing a heterozygous single nucleotide polymorphism (SNP) into a homozygous DNA sample. (G) Melting curves obtained following s-RT-MELT of EGFR exon 21 for lung tumor cell line H1975 (L858R mutation) and wild-type samples. (H) Melting curves obtained following s-RT-MELT of EGFR exon 19 for lung tumor cell line LU011 (L747-E749 deletion) and from wild-type samples. (I) Melting curves obtained following s-RT-MELT of EGFR exon 21 for FFPE lung tumor samples #2, #21, #6 and #10, curves 3, 1, 2 and 4, respectively.

